Spot Bitcoin ETF flows: what the daily numbers mean
On this page
Since January 2024, people in the US can buy Bitcoin through exchange-traded funds in an ordinary brokerage account. Daily "ETF flow" numbers are now some of the most quoted figures in crypto news. This is what they measure and how much weight to give them.
What a spot Bitcoin ETF is
On 10 January 2024 the US Securities and Exchange Commission approved the first spot Bitcoin exchange-traded products, and trading started the next day. Each fund holds actual bitcoin with a custodian, and each share represents a slice of those holdings. Spot Ether funds followed in July 2024.
Investors buy and sell the shares on a stock exchange like any other fund. They never handle private keys themselves.
Where flows come from
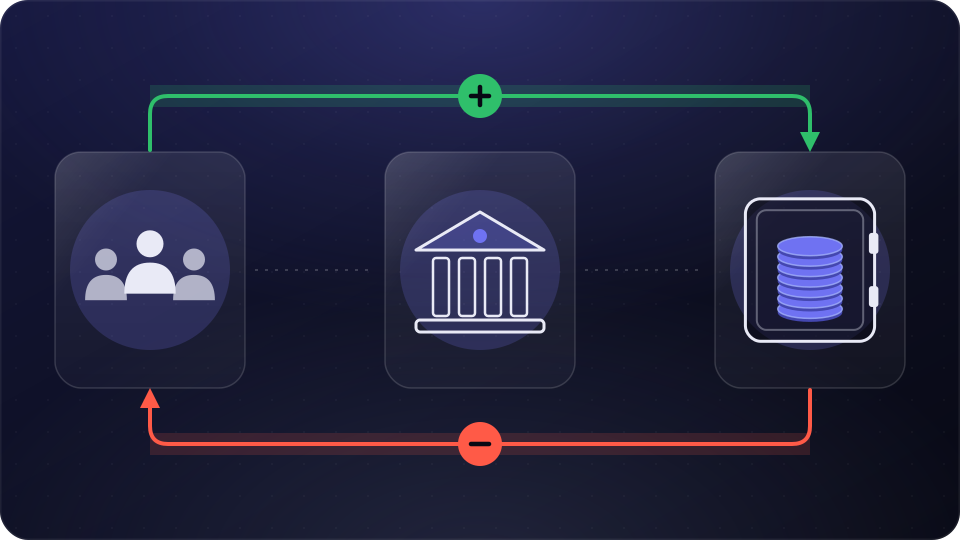
When demand for shares rises, large market makers called authorised participants create new shares by delivering cash or bitcoin to the fund, and the fund holds more bitcoin. When investors sell, shares can be redeemed and the fund's holdings shrink.
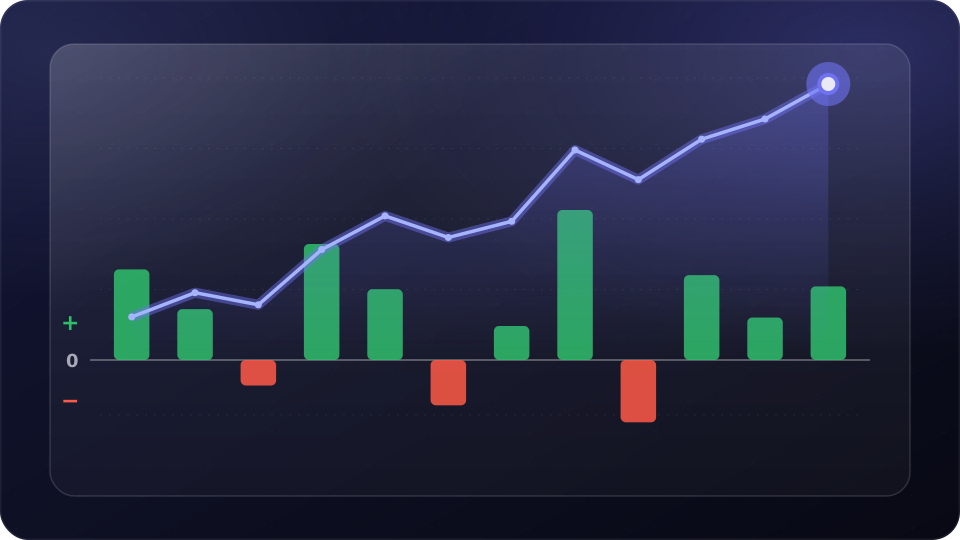
A day's net flow is the value of new shares created minus shares redeemed. Positive means money came in; negative means money left.
How to read the daily numbers
- A single day says little. Look at the trend over one or two weeks.
- Compare flows with the size of the funds. A given amount is large for a small fund and minor for a big one.
- Flows are usually reported after the US market closes, and aggregators sometimes revise them the next day.
- Strong inflows often coincide with rising prices, but the cause can run both ways: rising prices also attract inflows.
What flows cannot tell you
ETF flows show one group of buyers: mostly US investors and institutions using brokerage accounts. They do not show what happens on crypto exchanges, in other countries or among long-term holders. Use them as one input alongside price, on-chain data and the macro calendar, not as a forecast.
Where to find the figures
Each fund issuer publishes its holdings on its own website, usually once a day. Several data sites collect these into a single daily table of net flows per fund. Because each site gathers the data slightly differently, totals can differ a little between sources, so stick to one source when you compare days.
It also helps to look at holdings counted in bitcoin, not only in dollars. A fund's dollar value rises and falls with the price even when no shares are created or redeemed. Holdings counted in coins show whether the fund actually bought or sold.
For education only, not financial advice. Crypto assets are volatile and you can lose money.
Get one like this every morning
A 5-minute briefing in your inbox each weekday. Free, unsubscribe anytime.
Or follow the Telegram channel @pakaoqpMarket now
Latest news