Support and resistance: what “key levels” really mean
On this page
Traders talk about "key levels" all the time. Behind the jargon is a simple idea: prices tend to react where many people made decisions before. Here is what support and resistance really are, and how to use them without treating them as magic lines.
What the terms mean
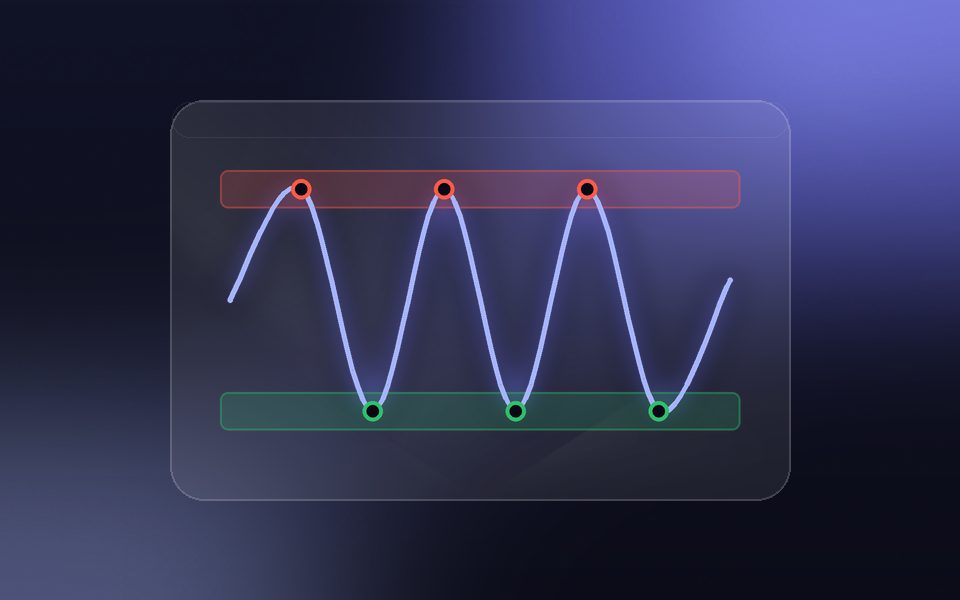
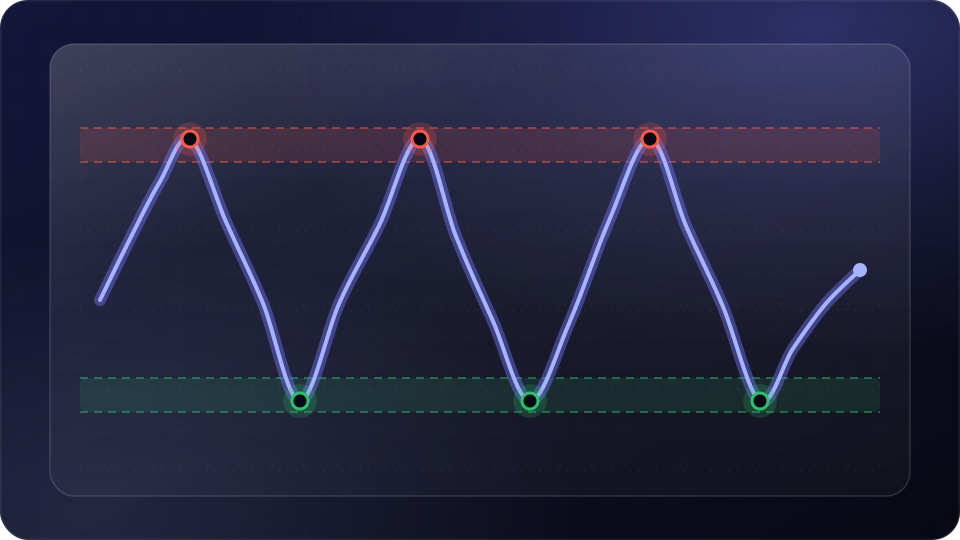
Support is a price area where falling prices have stopped or bounced in the past, because buyers stepped in. Resistance is the opposite: an area where rising prices have stalled because sellers took profit or new sellers appeared.
Both are zones, not exact numbers. If Bitcoin turned higher three times somewhere between two nearby prices, that whole band is the support area. Drawing a single thin line suggests more precision than the market ever offers.
Why these levels work at all
Levels matter because people remember them. Someone who bought at a level and watched the price fall may sell when it gets back there, just to break even. Others place orders at round numbers or at previous highs and lows. When enough orders cluster in one area, the price often pauses there.
That also explains why levels fail. They are only a record of past behaviour. If the reason people cared about a price disappears, the level stops mattering.
When a level breaks
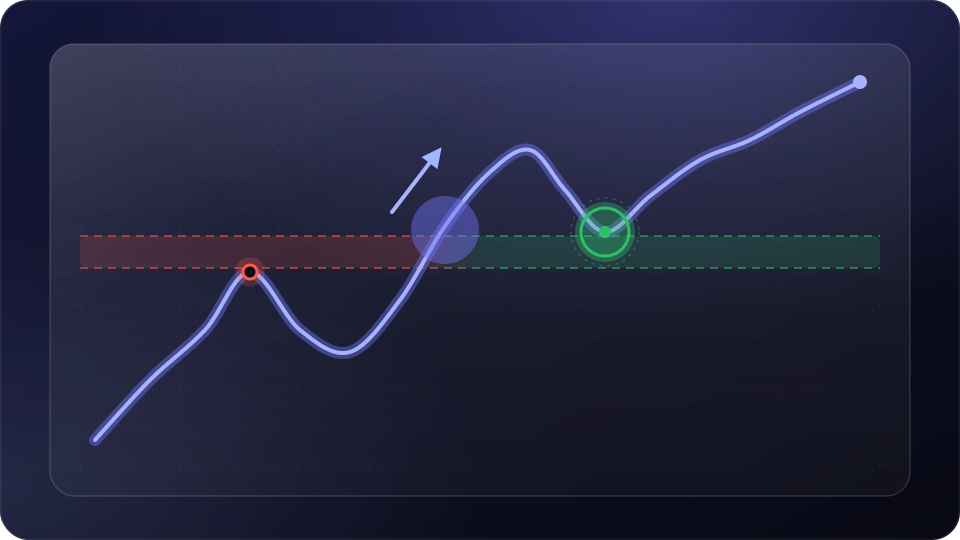
A clean break through resistance often turns it into support, and a break below support often turns it into resistance. Traders call this a role reversal. A common pattern is a break, a pullback to the old level, and then a move away from it.
How to use levels sensibly
- Mark zones on a daily or weekly chart first; levels on short timeframes are noisy and break easily.
- Look for areas the price reacted to several times, not one random wick.
- Use levels to plan, not to predict: where would your idea be wrong, and where would you take profit?
- Expect false breaks, especially in crypto, where thin weekend trading can push prices through a level for a few hours.
A simple routine to try
Open a daily chart of Bitcoin covering the last six months. Mark the two or three areas where the price turned most clearly, and shade each one as a band rather than a line. Then switch to a weekly chart and check whether the same areas show up there too. Zones that appear on both timeframes tend to get more attention from other traders.
When the price approaches one of your zones, write down in advance what would change your mind: a daily close beyond the band, for example, rather than a brief move through it. Writing the rule down before the price arrives keeps the decision calm and stops you from redrawing lines to fit what you hope will happen.
For education only, not financial advice. Crypto assets are volatile and you can lose money.
Get one like this every morning
A 5-minute briefing in your inbox each weekday. Free, unsubscribe anytime.
Or follow the Telegram channel @pakaoqpMarket now
Latest news